- The US dollar is strengthening as it tests its July highs near 103.5
- Meanwhile, the euro has weakened, and the yen has rallied against the greenback
- Overall, the dollar could remain strong going forward as the euro and yen weaken
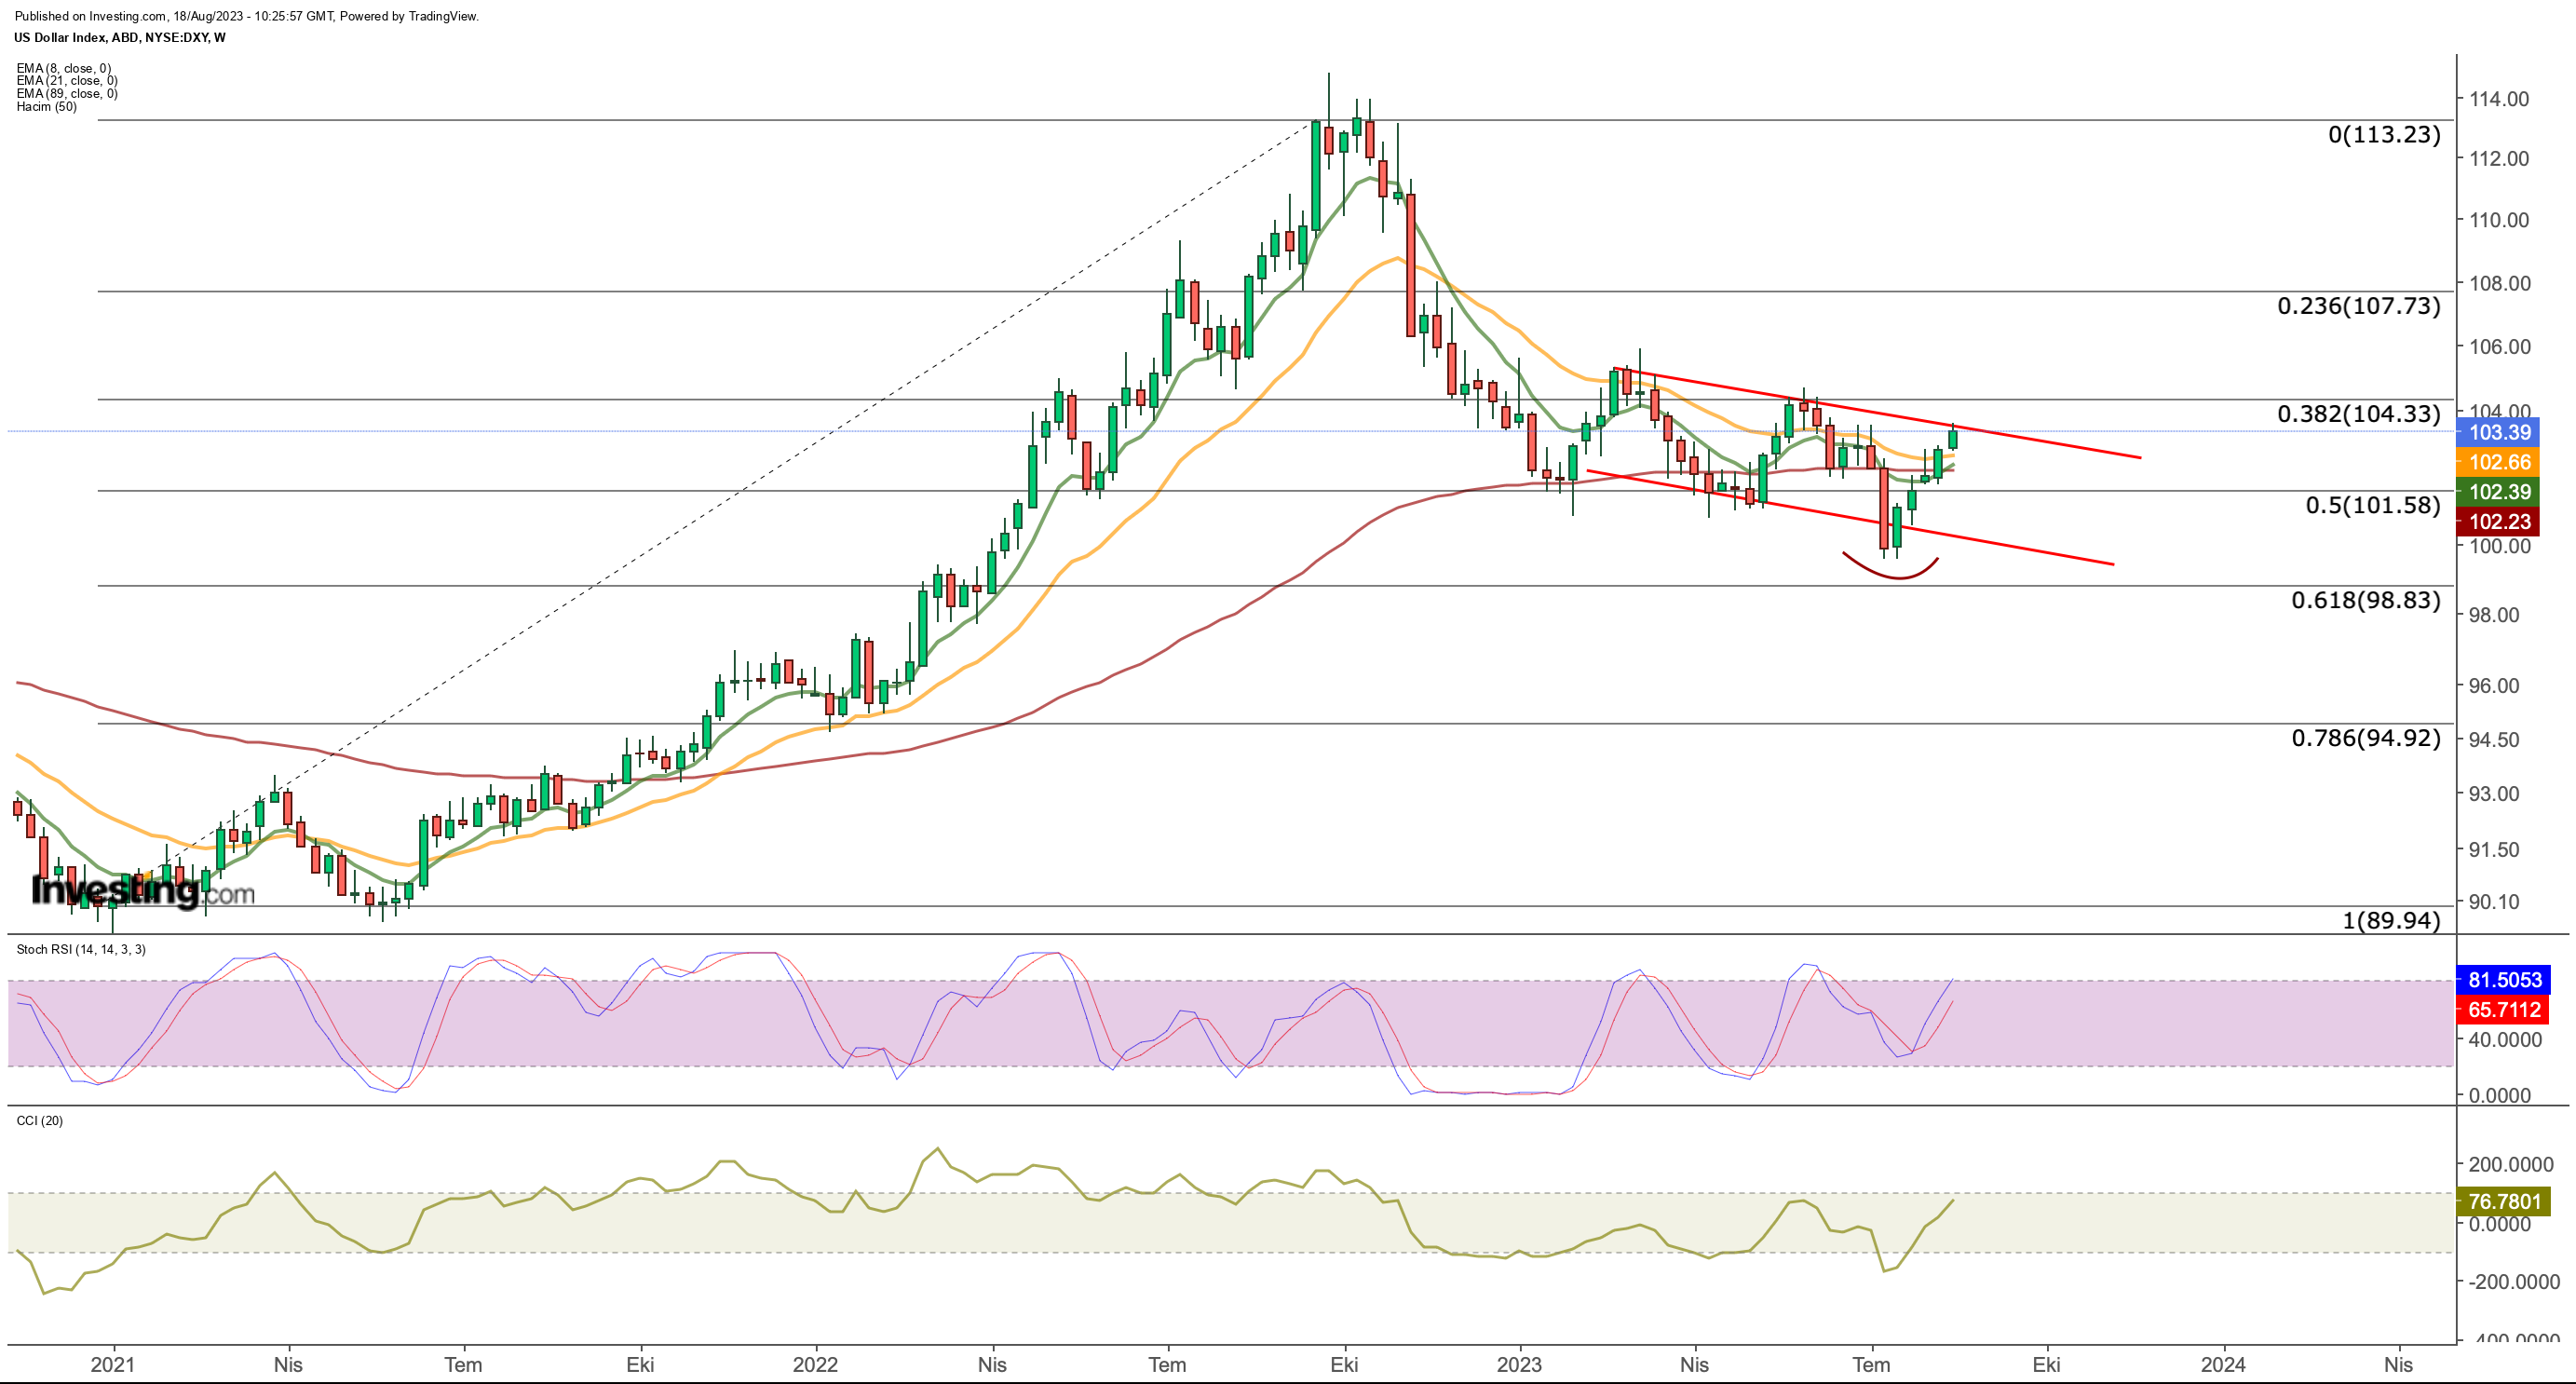
The is currently forming a new peak within its 2023 trend. This trend has seen lower peaks in March, May, and most recently in July.
As the greenback continues to gain strength this week, it tests waters above its July peak of 103.5. This is a crucial point, and we’ll closely watch if the index breaks the pattern of lower peaks and starts a reversal in the downtrend.
The movement of Treasury yields could also play a significant role in pushing the DXY higher. This is backed by the Federal Reserve’s policy stance and strong data coming from the US.
This week brought some important events. US exceeded expectations, signaling economic strength. Moreover, the Federal Open Market Committee (FOMC) reaffirmed the Fed’s commitment to the 2% target.
Hawkish statements suggested that a prolonged period of higher interest rates could be on the table, strengthening the dollar. Additionally, unemployment benefit applications matched projections, and there was a noticeable jump in the , all contributing to a robust dollar stance.
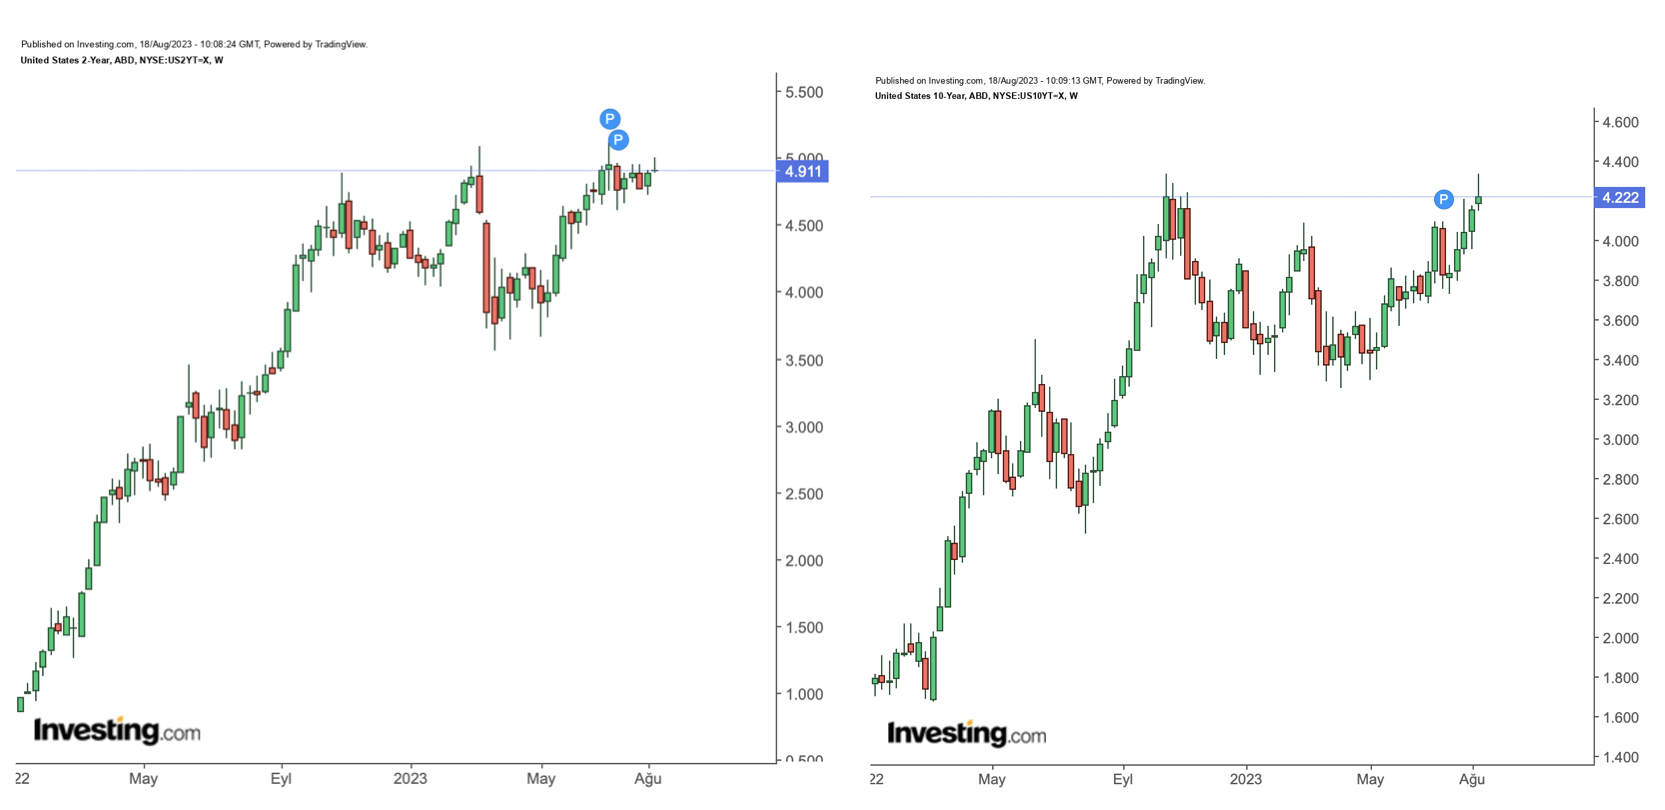
Conversely, US and treasury yields have been climbing since March, revisiting peak levels seen during the pandemic. This week, the 2-year treasury yield hit 5%, and the 10-year yield reached 4.33%.
If these levels are broken, it could be bullish for the dollar.


Considering the upward momentum in the DXY, it appears that the dollar is factoring in the possibility of the Fed refraining from an early rate cut, contingent on economic data and the potential for another 25 basis point increase before the year’s end.


In line with this perspective, if the DXY index consistently closes above the 104.3 level on a weekly basis, supported by a potential breakout in US bond yields, it could serve as a signal for a breakout and potentially drive the dollar’s movement toward the 108 level.
Conversely, if the critical resistance level of 103 is not surpassed, it could lead to pressure on the dollar. In such a scenario, we might anticipate a retreat towards the 100 level within the DXY’s oscillation movement within its channel.
EUR/USD Technical View
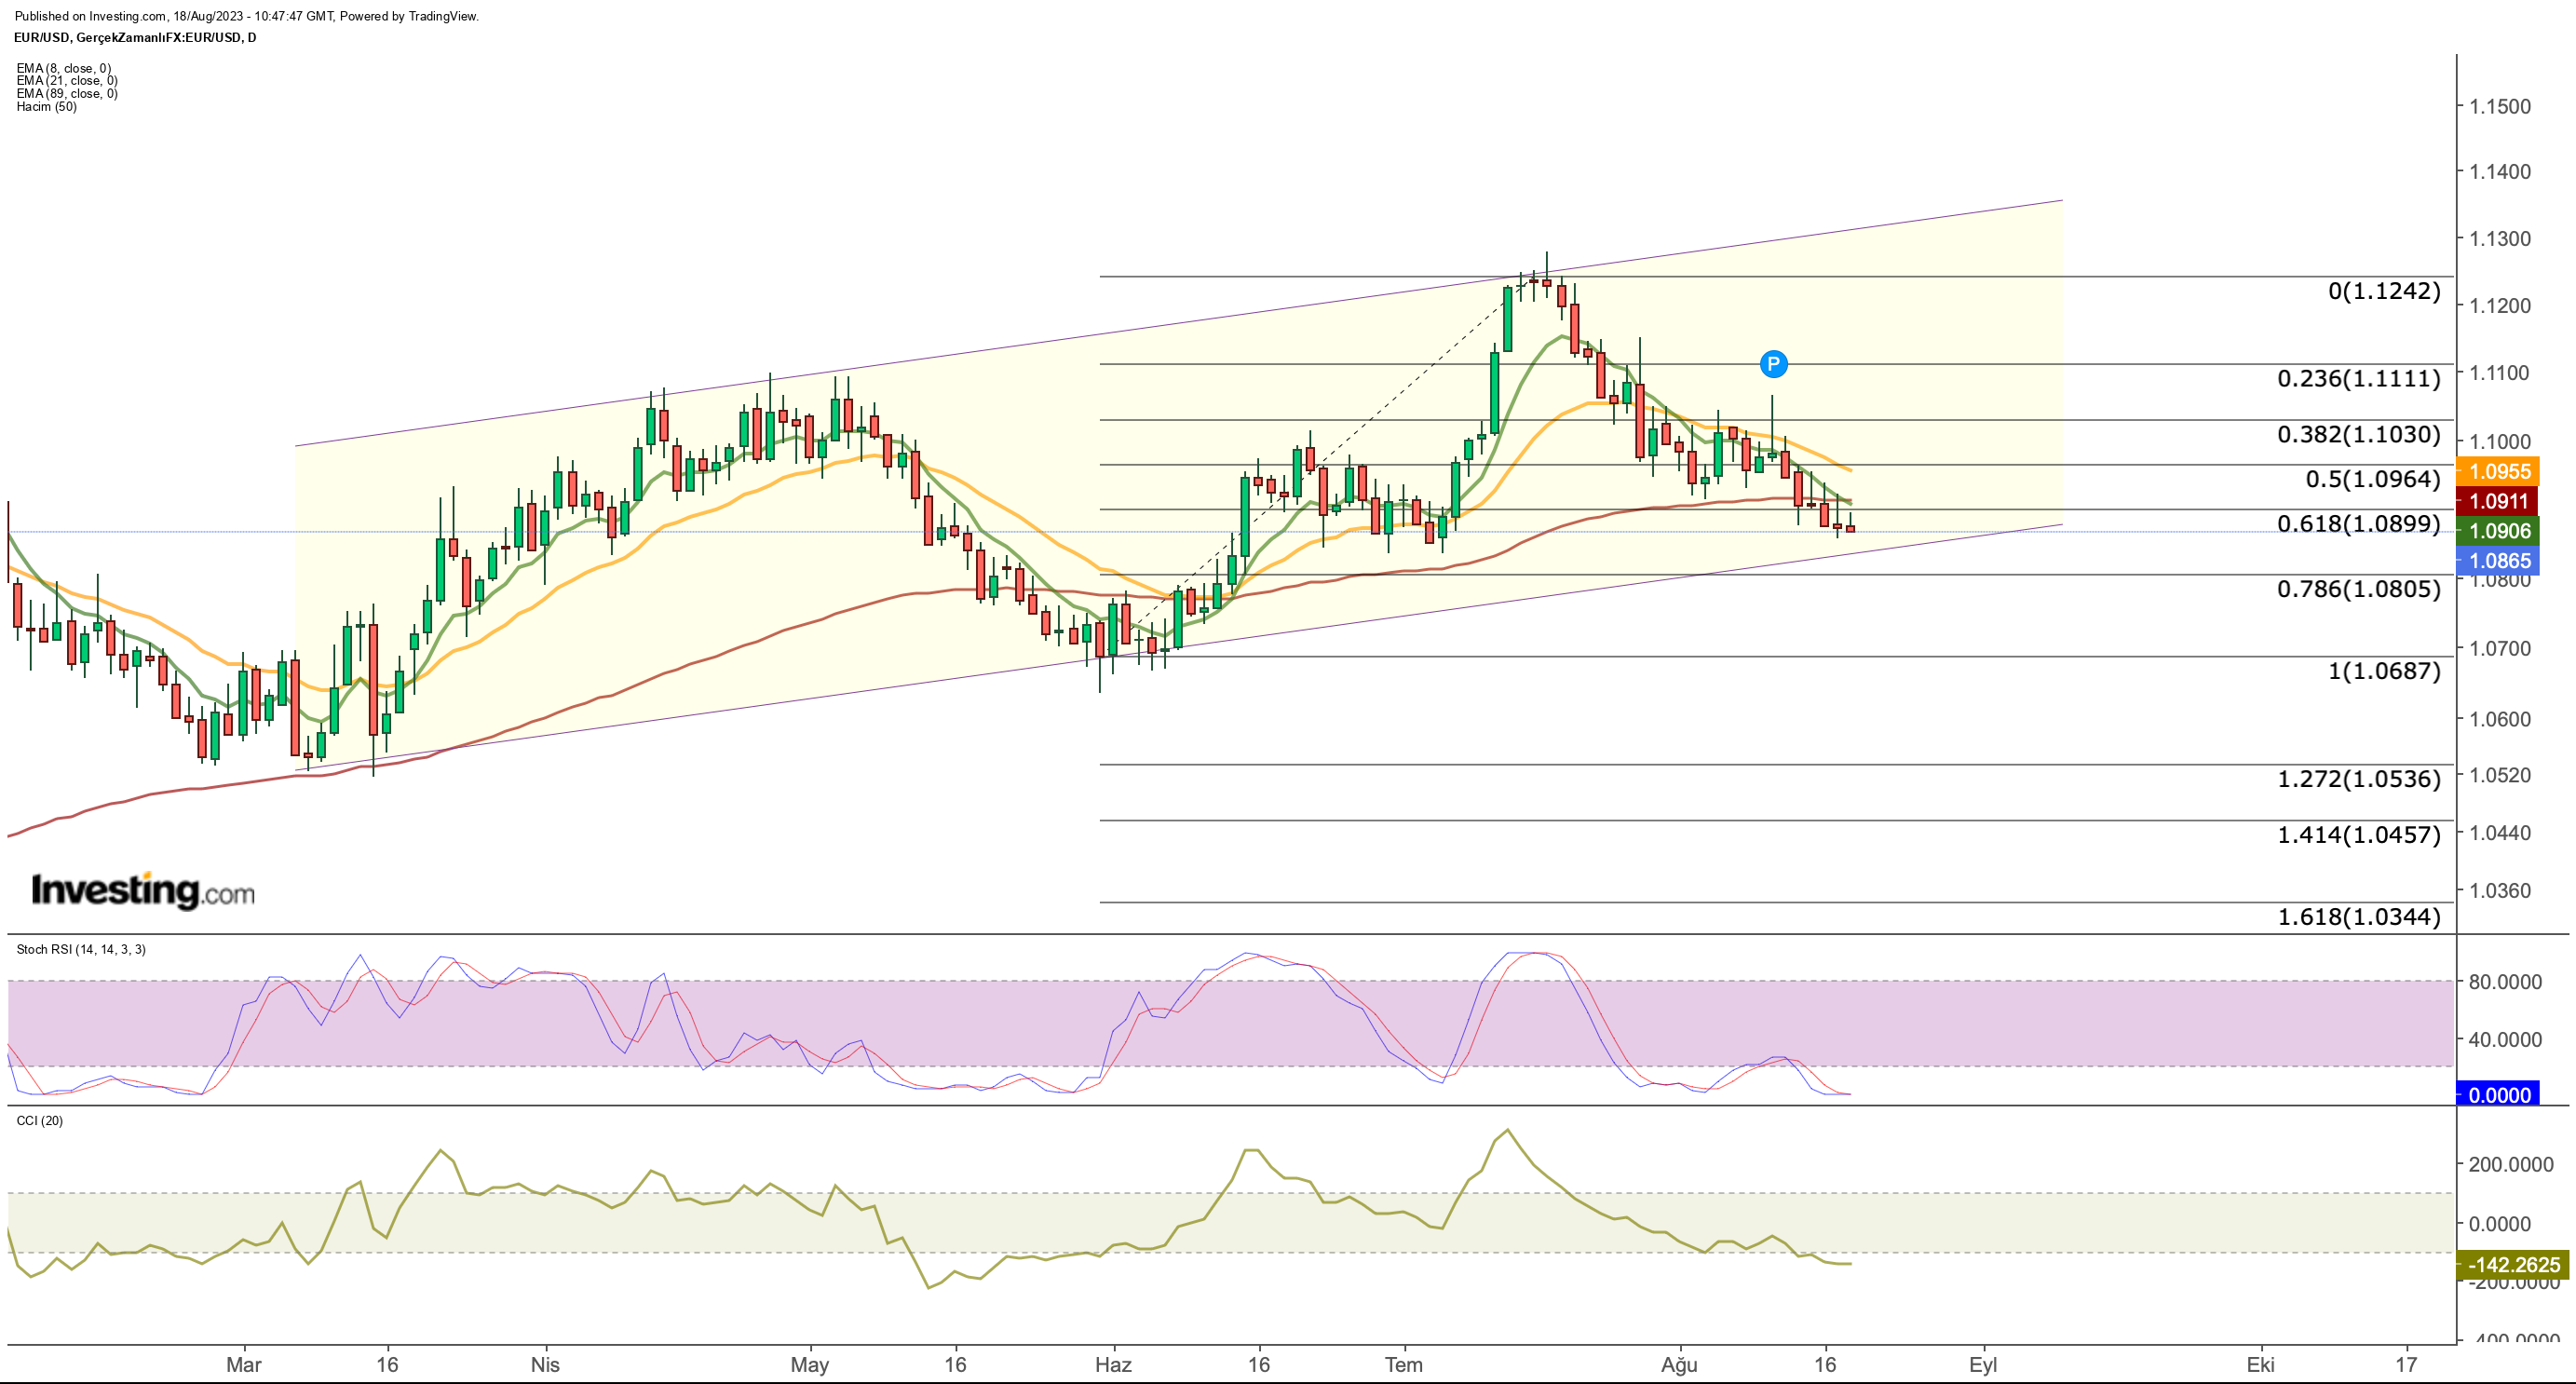
The pair maintained its downward trajectory against the dollar over the week. This movement remains consistent with the medium-term ascending channel observed earlier.
On the daily chart, while there were indications of a potential reversal in the short-term retracement that had been ongoing for the past month, the pair concluded the week with a close below the 1.1 level.
As a result, the downward trend persisted, directing the pair toward the lower boundary of the channel.


At this juncture, the 1.08 – 1.083 level holds significant importance for the EUR/USD pair. From a technical standpoint, a downward breach of this price level could potentially signal the initial indications of a trend reversal.
Additionally, attention has been drawn to the occurrence of short-term Exponential Moving Average (EMA) values crossing below the 3-month EMA. Following the positive EMA crossover in June, the EUR/USD pair ascended to around the 1.12 level.
Accordingly, if daily closures fall below 1.08, it could amplify expectations of further weakness, potentially bringing the 1.05 region into focus as the next potential low for EUR/USD, akin to its levels in the first quarter of the year.
On the flip side, preserving the 1.08 support level would sustain the channel’s momentum. This could lead to discussions about the EUR/USD pair surmounting the 1.1 resistance, prompted by reactive purchases, and potentially forging a fresh 2023 peak beyond the 1.1277 level.
Lastly, the Stochastic Relative Strength Index (RSI) on the daily chart suggests that present levels might represent a bottom. Nevertheless, for the signal to gain confirmation, the indicator must establish a floor above the 20 level.
USD/JPY
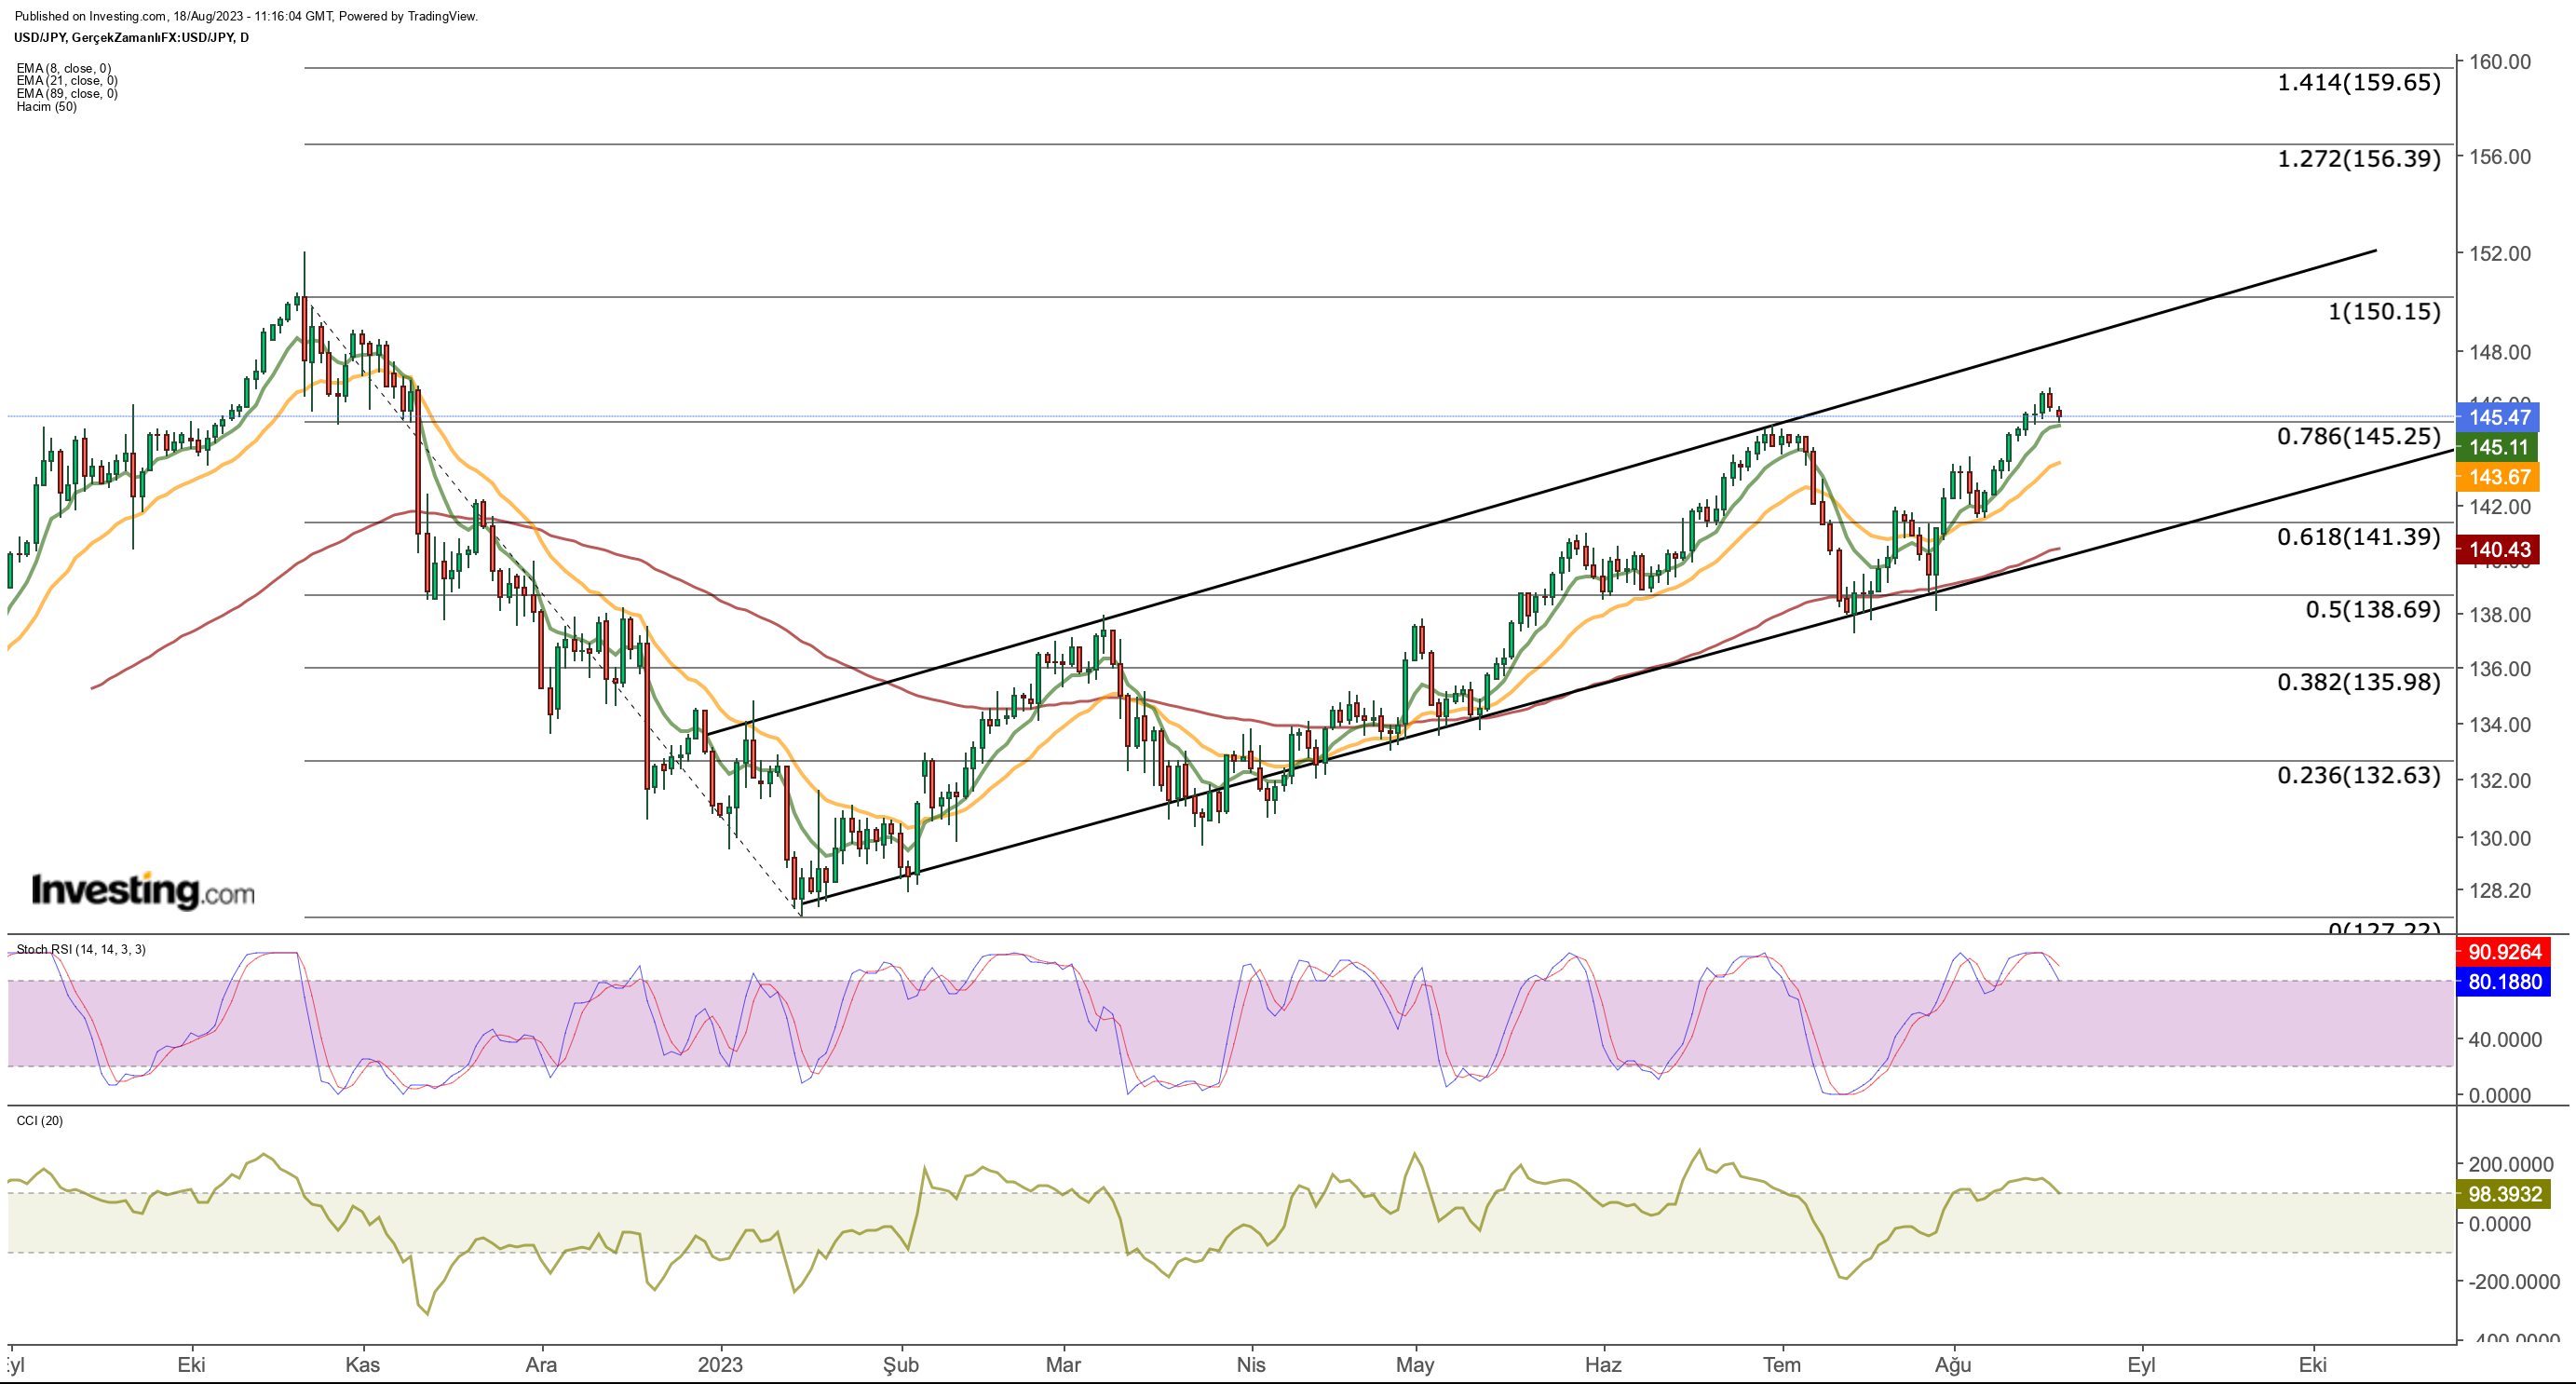
maintained its upward trajectory throughout the week, following a correction in July. This week, the pair made an attempt to breach a significant resistance zone.


USD/JPY climbed to around 145 yen this week, hitting the Fib 0.786 level, aligning with the downtrend that was initiated in the last quarter of the previous year.
After the Bank of Japan (BoJ) intervened in the market due to an upward trend in the exchange rate last year, a downward momentum gained traction until the beginning of 2023. Currently, USD/JPY appears to have returned to the intervention zone.
During this week, the pair achieved its highest point of the year at 146.5. If this peak is surpassed and maintained with daily closures in the upcoming week, the potential reemergence of intervention discussions around the 150 yen zone will be closely monitored.
Conversely, the BoJ is employing a counter approach by sustaining a negative interest rate environment through its accommodative monetary policy, contrasting the tightening policy of the Federal Reserve.
Although this dynamic favors the dollar’s position, the introduction of a new yen purchasing strategy by the BoJ could induce a shift in the trend’s direction. In this scenario, USD/JPY might establish new lower levels below 140 in a possible downtrend.
Today, Japan released its data, revealing a further deceleration in core inflation to 3.1% in July, down from 3.3% in June. Despite the slowdown, it’s unlikely that inflation will meet the BoJ’s short-term 2% target.
Nevertheless, compared to other central banks in developed nations where inflation is waning despite ongoing expansionary policies, the BoJ seems to have a more lenient stance regarding inflation.
***


Find All the Info you Need on InvestingPro!
Disclaimer: This article has been written solely for informational purposes; it does not constitute a solicitation, offer, advice, consultation, or recommendation for investment, nor does it intend to encourage the purchase of assets in any way. Please note that any type of asset is evaluated from multiple perspectives and carries high risk. Therefore, every investment decision and its associated risks are the responsibility of the investor.
คำแนะนำการอ่านบทความนี้ : บางบทความในเว็บไซต์ ใช้ระบบแปลภาษาอัตโนมัติ คำศัพท์เฉพาะบางคำอาจจะทำให้ไม่เข้าใจ สามารถเปลี่ยนภาษาเว็บไซต์เป็นภาษาอังกฤษ หรือปรับเปลี่ยนภาษาในการใช้งานเว็บไซต์ได้ตามที่ถนัด บทความของเรารองรับการใช้งานได้หลากหลายภาษา หากใช้ระบบแปลภาษาที่เว็บไซต์ยังไม่เข้าใจ สามารถศึกษาเพิ่มเติมโดยคลิกลิ้งค์ที่มาของบทความนี้ตามลิ้งค์ที่อยู่ด้านล่างนี้
Source link


