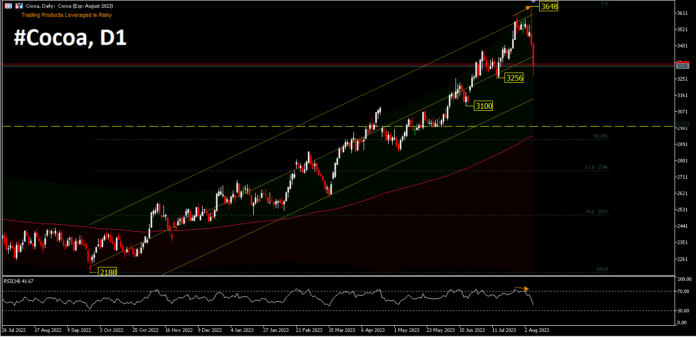
Cocoa started a sharp decline earlier this week, to a 4-week low. Cocoa prices sold off Tuesday amid reports that heavy rains have ended and weather conditions are improving in West Africa, which will benefit cocoa crop growth and fieldwork. This situation was utilised by some investors to unwind their contract positions.
The strengthening of cocoa prices over the past two months has been influenced by extreme weather in West Africa which has accelerated the spread of fruit rot disease. The spread of the disease from extreme wet weather could result in a decline in cocoa crop quality and production and push the global cocoa market into a third year of deficit for the 2023-2024 season, pushing prices to a 12-year peak of $3,648/tonne this week. Improving weather, however, has increased expectations of a short-term increase in supply and fuelled some of the downside.
The start of high demand is technically visible, as #Cocoa prices began their first ascent in October 2022 from a low of $2,188. The price has risen more than 50% during this period, which is a big gain. The positive price movement stayed within the bullish regression channel applied to the trend since October, even breaking above the upper trend line of the channel two weeks ago, as shown on the daily chart.
Negative indications occurred in Monday’s trading (07/08), when the price generated the divergence bias seen on the RSI. Nevertheless, it is too early to write off the long-term trend that has been established. Tuesday’s drop recorded a low of $3,261 which almost matched the July low ($3,256) by a few points. This drop does seem sudden and not a typical trend change, given that distribution phases take a relatively long time to generate a change in interest.
For now, the nearest technical support level is $3,256. As long as this support holds, price could move back into the upper space of the regression, while a break of this level however could bring a number of declines for support around $3,100. Structural support is seen at $2,989 (yellow line) which is the 2020 peak price that will maintain buying interest at this level, given that this level is also around the 200-day moving EMA.
Click here to access our Economic Calendar
Ady Phangestu
Market Analyst – HF Educational Office – Indonesia
Disclaimer: This material is provided as a general marketing communication for information purposes only and does not constitute an independent investment research. Nothing in this communication contains, or should be considered as containing, an investment advice or an investment recommendation or a solicitation for the purpose of buying or selling of any financial instrument. All information provided is gathered from reputable sources and any information containing an indication of past performance is not a guarantee or reliable indicator of future performance. Users acknowledge that any investment in Leveraged Products is characterized by a certain degree of uncertainty and that any investment of this nature involves a high level of risk for which the users are solely responsible and liable. We assume no liability for any loss arising from any investment made based on the information provided in this communication. This communication must not be reproduced or further distributed without our prior written permission.
คำแนะนำการอ่านบทความนี้ : บางบทความในเว็บไซต์ ใช้ระบบแปลภาษาอัตโนมัติ คำศัพท์เฉพาะบางคำอาจจะทำให้ไม่เข้าใจ สามารถเปลี่ยนภาษาเว็บไซต์เป็นภาษาอังกฤษ หรือปรับเปลี่ยนภาษาในการใช้งานเว็บไซต์ได้ตามที่ถนัด บทความของเรารองรับการใช้งานได้หลากหลายภาษา หากใช้ระบบแปลภาษาที่เว็บไซต์ยังไม่เข้าใจ สามารถศึกษาเพิ่มเติมโดยคลิกลิ้งค์ที่มาของบทความนี้ตามลิ้งค์ที่อยู่ด้านล่างนี้
Source link


