Nvidia Corp. is an American multinational technology company which engages in the design and manufacture of computer graphics processors, chipsets and related multimedia software. It operates through various segments namely Graphics Processing Unit (GPU) (ie. GeForce (gaming), Quadro (designing), Tesla and DGX (AI data and big data research), Grid (cloud-based visual computing), Tegra Processor (to drive supercomputing for autonomous robots, drones, cars, as well as consoles, mobile gaming and entertainment devices), and the All Other segment (stock-based compensation expense, corporate infrastructure and support costs, acquisition-related costs, and other non-recurring charges).
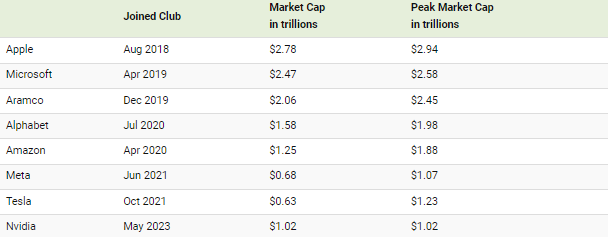

Nvidia’s market cap hit $1 trillion milestone in this May, the first time ever in the chipmaker’s history following a surge in market interest over artificial intelligence. It is the 8th company to join the trillion dollar club, after Apple, Microsoft, Aramco, Alphabet, Amazon, Meta and Tesla. This Wednesday (23rd August), Nvidia shall report its earnings result for Q2 2023, after market close. As a barometer for the whole AI hype, the earnings performance that is going to be delivered by the tech behemoth shall definitely be the centre of attention.
The electronic technology sector closed the week with losses -1.33%. Its 1-month performance has been down -8.5%, the second worst performed sector after consumer durables (-13.94%). By industry, semiconductors were down -0.62% for the week, and -10.23% in 1 month. Regardless, all sectors in the U.S. closed the week in negative – this explains the market’s reaction to the possibility that the Fed may continue to tighten its monetary policy in the near term and after bond yields soared. Fed chair Jerome Powell’s speech at Jackson Hole this week shall be closely watched to gauge any hint regarding the central bank’s monetary policy in near term.
Nvidia: Revenues & Earnings (After Deduction of Tax and Expenses). Source: Tipranks
NVIDIA’s latest reported revenue was $7.19 billion, up 19% sequentially but down -13% year-over-year. Operating income rose 25% sequentially to $2.71 billion, but was down from -21% a year ago. Gross margin increased 0.7 percent sequentially to 66.8 percent, but was slightly lower than the 67.1 percent reported in the same period last year (source: NVIDIA press release).
Overall, the surge in demand for data centre products (AI and GPU chips) was the main positive catalyst. The segment itself generated a record $4.28 billion, up 14 percent (year-over-year) and 18 percent (sequentially). Automotive revenue was $296 million, up 114 percent year-over-year and 1 percent sequentially. Nonetheless, year-over-year results were slightly dragged down by the Gaming and Professional Visualisation businesses, whose revenues declined -38% and -53% year-over-year to $2.24 billion and $295 million, respectively.
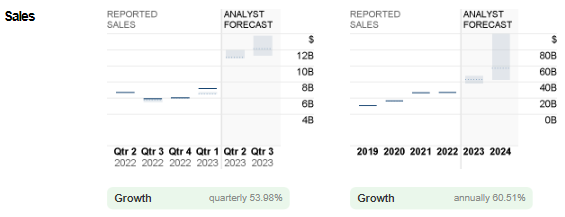
Nvidia: Reported Sales versus Analyst Forecast. Source: CNN Business
In the upcoming announcement, consensus estimates for sales of Nvidia stood at $11.1B, up over 54% from the previous quarter, and up over 65% from the same period last year. The expectation is slightly more optimistic than the management’s outlook, which projected revenue at around $11.0B. They also expected gross margin to improve +3.2% to 70.0% in the coming quarter.
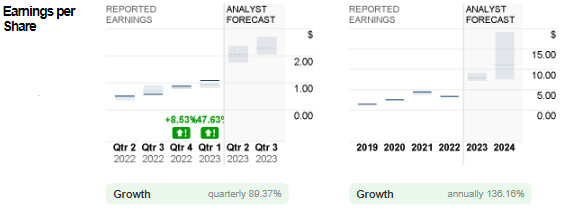
Nvidia: Reported EPS versus Analyst Forecast. Source: CNN Business
On the other hand, EPS is expected to hit $2.06, doubled from previous quarter $1.09. In the same quarter last year, the figure was $0.51.
Technical Analysis
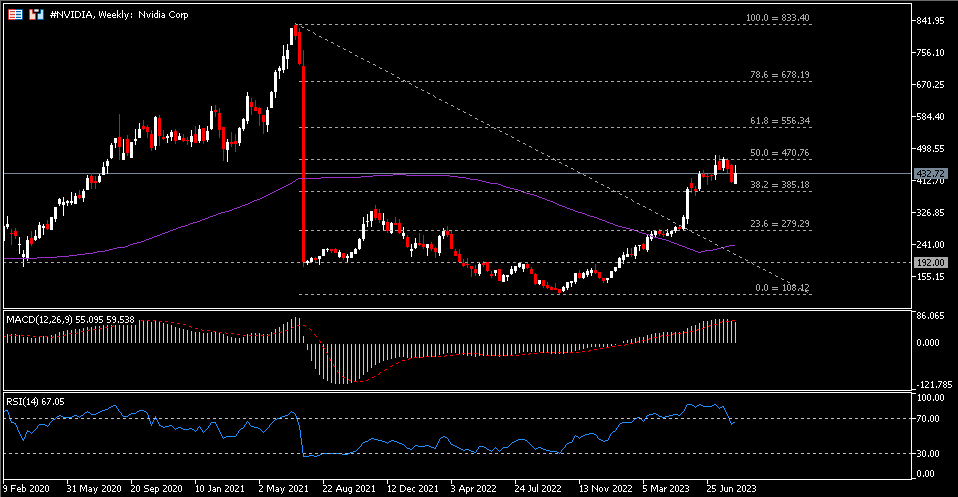
#NVIDIA share price managed to close with gains last week, above support $385 (FR 38.2%, extended from the peak in July 2021 to the lows in October 2022). Current price is -48% below the level before the company conducted its fifth 4-for-1 split on 20th July, 2021. $470.80, together with 52-week high ($480.11) serve as the nearest resistance to watch. A break above these resistance may indicate continuation of bullish trend which stemmed from October 2022, towards the next resistance at $556 (FR 61.8%). On the contrary, a close below $385 may suggest technical correction, with next support $279 (FR 23.6%) in focus. Lastly, MACD indicator remains above 0 but has just formed a dead cross; RSI retraced but still hovering near the overbought zone.
Click here to access our Economic Calendar
Larince Zhang
Market Analyst
Disclaimer: This material is provided as a general marketing communication for information purposes only and does not constitute an independent investment research. Nothing in this communication contains, or should be considered as containing, an investment advice or an investment recommendation or a solicitation for the purpose of buying or selling of any financial instrument. All information provided is gathered from reputable sources and any information containing an indication of past performance is not a guarantee or reliable indicator of future performance. Users acknowledge that any investment in Leveraged Products is characterized by a certain degree of uncertainty and that any investment of this nature involves a high level of risk for which the users are solely responsible and liable. We assume no liability for any loss arising from any investment made based on the information provided in this communication. This communication must not be reproduced or further distributed without our prior written permission.
คำแนะนำการอ่านบทความนี้ : บางบทความในเว็บไซต์ ใช้ระบบแปลภาษาอัตโนมัติ คำศัพท์เฉพาะบางคำอาจจะทำให้ไม่เข้าใจ สามารถเปลี่ยนภาษาเว็บไซต์เป็นภาษาอังกฤษ หรือปรับเปลี่ยนภาษาในการใช้งานเว็บไซต์ได้ตามที่ถนัด บทความของเรารองรับการใช้งานได้หลากหลายภาษา หากใช้ระบบแปลภาษาที่เว็บไซต์ยังไม่เข้าใจ สามารถศึกษาเพิ่มเติมโดยคลิกลิ้งค์ที่มาของบทความนี้ตามลิ้งค์ที่อยู่ด้านล่างนี้
Source link


