This week, investors will be looking at the earnings reports of two giants of the retail industry, Home Depot and Walmart. In general, Home Depot sells tools, building products, appliances, lighting fixtures, paint, flooring, plumbing supplies, outdoor equipment and services, while Walmart operates a chain of big-box stores, discount department stores and grocery shops. The two rank third and second, respectively, by global retail market capitalization, behind Amazon. Home Depot and Walmart will report their second quarter 2023 earnings before the market opens on Tuesday, 15 August and Thursday, 17 August, respectively.
U.S. retail sales growth and chain shop sales (in millions of dollars). Source: Trading Economics
Overall, US retail sales in the second quarter of 2023 signalled resilient consumer spending, albeit still well below the level seen in January of this year. Sales improved at miscellaneous shop retailers, non-store retailers, furniture, electronics and appliances, apparel, motor vehicle and parts dealers, food services, and drinking establishments. In contrast, gas stations, building materials and gardening equipment, sporting goods, music and books, food and beverage shops, health and personal care shops, and department stores experienced sales declines. In addition, chain shop sales have been growing steadily so far this year and are up more than 40 percent from the low point in January ($1.856 billion).
Home Depot
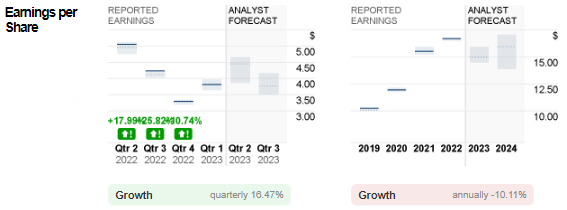
For the first quarter of 2023, Home Depot reported revenue of $37.26 billion, missing Wall Street expectations for the second consecutive quarter (and the largest margin of missing expectations in more than 20 years). The figure was down -4.2% from the same period last year. Other items that underperformed compared to Q1 2022 were operating income ($5.55 billion, down -6.4%), net income ($3.87 billion, down -8.5%), and diluted EPS ($3.82, down -6.6%).
The company said some of the reasons for the weak results last quarter included cold weather and lumber deflation, rising interest rates dampening the appetite of prospective homebuyers and cooling home values, and a shift in consumer spending patterns (towards travelling, eating out, etc.).
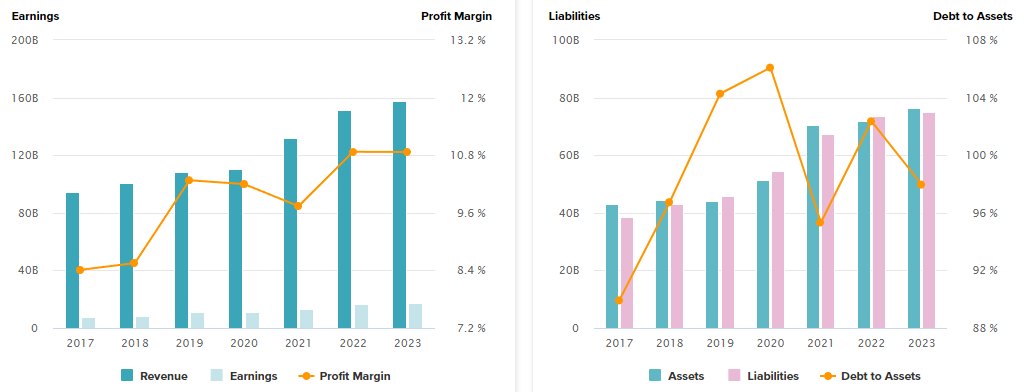
In FY2022, Home Depot recorded a profit margin of 10.87%, its highest level in decades. As of the first quarter of 2023, its profit margin reached 10.75%. In contrast, gearing was over 100% last year, but recently dropped to 97.96%. While the company does carry debt, it doesn’t seem to be an issue of undue concern as analyses show that the company has strong free cash flow equal to 60% of EBITDA and can easily pay down and reduce debt when needed.
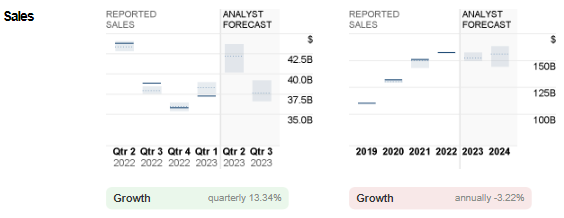

On the other hand, earnings per share is expected to increase by about 16.5 per cent from the previous quarter to $3.82. In the same period last year, the company reported earnings per share of $5.05.
All in all, management expects 2023 to be a “solid year”. Compared to fiscal 2022, the company expects sales and comparable sales to decline by -2% to -5% and diluted earnings per share to decline by -7% to -13%. Operating margin is expected to be in the range of 14.0 to 14.3 percent.
HOME DEPOT Techical Analysis
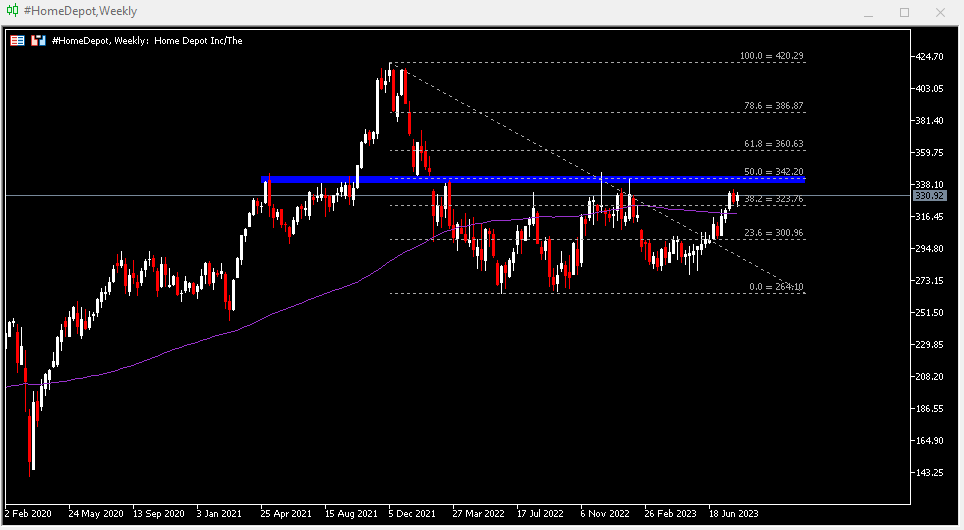
#HomeDepot stock hit a low of $264.10 last year. This year, it formed a higher low of $277.05 before continuing higher. As of last week’s close, the company’s shares remained supported above its 100-week moving average and above $324 (38.2% of the FR extending from the December 2021 high to the June 2022 low). The nearest resistance is at $342 (FR 50.0%) and the December 2022 high ($346.12), followed by $361 (FR 61.8%). Otherwise, support is at $301 (FR 23.6%) around $324 and the 100-week SMA, then at $264.10.
Walmart
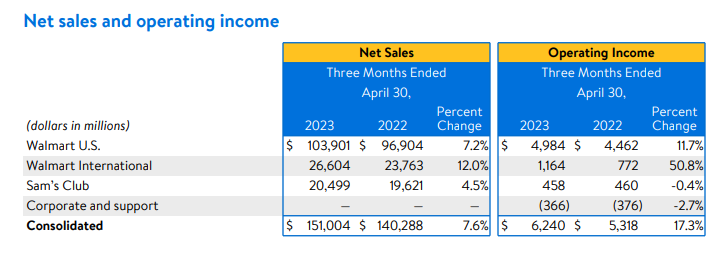
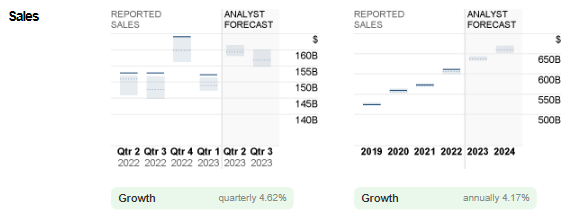
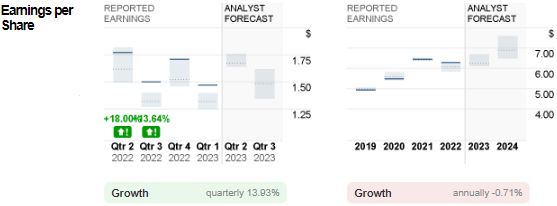
Walmart’s key financial metrics were solid last quarter compared to Home Depot. Sales revenue increased 7.6% year-over-year to $152.3 billion. The company continued to see growth in local e-commerce (up 27% year-over-year) and international e-commerce (up 25% year-over-year, driven primarily by China, Walmex, and Flipkart) – the former driven by strength in pickups, deliveries, and advertising, and the latter driven by strength in shop delivery and advertising. Additionally, a division of Walmart – Sam’s Members (a paid membership warehouse that sells groceries and household goods in bulk) reported a 4.5% year-over-year increase in net sales to $20.5bn, record membership and Plus penetration, and more than 50% growth in active advertisers (year-over-year), on the back of strong growth in membership revenues. (Source: Walmart Q1 FY2024 Earnings Report).


Operating income rose 17.3% year-over-year to $6.2 billion. In terms of business segments, the main contribution came from Walmart US ($4.46 billion, up +11.7% year-over-year), but we also saw great progress in Walmart International, where operating income jumped more than 50% year-over-year. Sam’s Club and Corporate & Support reported small losses slightly offsetting the former’s positive results.



WALMART Technical Analysis:
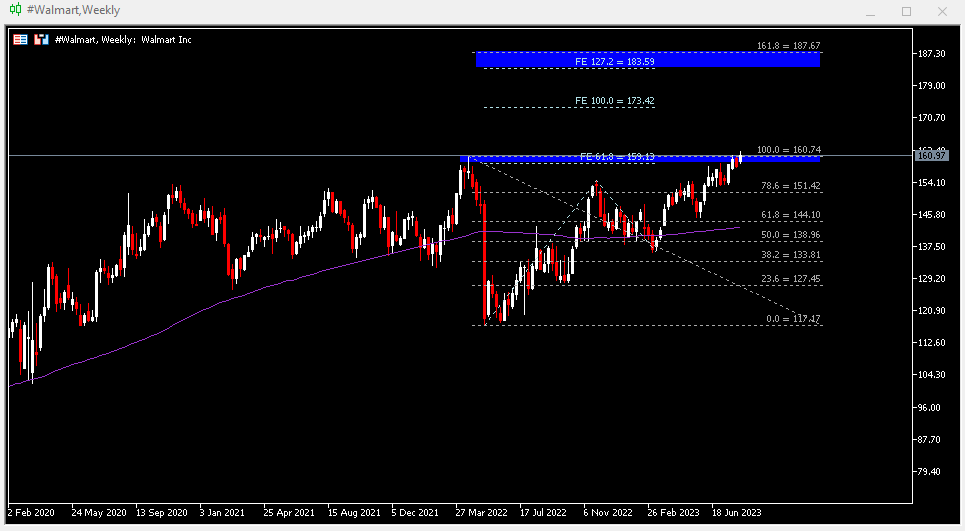
#Walmart created a new ATH last week at $162.09 (previous price was $160.74 in April 2022) It is currently testing a resistance zone of $159.10 – $160.70. If the bullish breakout is successful, the company’s shares will go on to test $170, followed by the Fibonacci expansion forecast of $173.40. 151.40 (FR 78.6%) is the nearest support level, followed by $144.10, dynamic support 100-week SMA and $139 (FR 50.0%).
Click here to access our Economic Calendar
Larince Zhang
Market Analyst
Disclaimer: This material is provided as a general marketing communication for information purposes only and does not constitute an independent investment research. Nothing in this communication contains, or should be considered as containing, an investment advice or an investment recommendation or a solicitation for the purpose of buying or selling of any financial instrument. All information provided is gathered from reputable sources and any information containing an indication of past performance is not a guarantee or reliable indicator of future performance. Users acknowledge that any investment in Leveraged Products is characterized by a certain degree of uncertainty and that any investment of this nature involves a high level of risk for which the users are solely responsible and liable. We assume no liability for any loss arising from any investment made based on the information provided in this communication. This communication must not be reproduced or further distributed without our prior written permission.
คำแนะนำการอ่านบทความนี้ : บางบทความในเว็บไซต์ ใช้ระบบแปลภาษาอัตโนมัติ คำศัพท์เฉพาะบางคำอาจจะทำให้ไม่เข้าใจ สามารถเปลี่ยนภาษาเว็บไซต์เป็นภาษาอังกฤษ หรือปรับเปลี่ยนภาษาในการใช้งานเว็บไซต์ได้ตามที่ถนัด บทความของเรารองรับการใช้งานได้หลากหลายภาษา หากใช้ระบบแปลภาษาที่เว็บไซต์ยังไม่เข้าใจ สามารถศึกษาเพิ่มเติมโดยคลิกลิ้งค์ที่มาของบทความนี้ตามลิ้งค์ที่อยู่ด้านล่างนี้
Source link


