Speech by Luis de Guindos, Vice-President of the ECB, at the Distinguished Speakers Seminar organised by the European Economics and Financial Centre, University of London
London, 6 November 2024
I am delighted to be here today at the European Economics and Financial Centre seminar, hosted by the University of London.[1] My comments today will focus on the economic developments in the euro area and the Governing Council’s monetary policy decisions taken in October. I will discuss our assessment of the outlook for the euro area economy and the current disconnect between growing real incomes and weak consumption growth. I will also share some reflections on the distributional implications of the recent inflation surge and what these mean for monetary policy. I will conclude by explaining the rationale for our recent decision to take another step in moderating the degree of monetary policy restriction.
Inflation developments and monetary policy response
In the aftermath of the pandemic, inflation rose rapidly over the course of 2021 and 2022, peaking at 10.6% in October 2022. This inflation surge was predominantly driven by a sequence of large and overlapping supply shocks, including the dynamics of post-pandemic reopening, which put severe strain on global supply chains and Russia’s war against Ukraine that led to a further spike in energy prices. The Governing Council responded forcefully to the inflation surge, in particular by raising our policy rate by 450 basis points between July 2022 and September 2023.
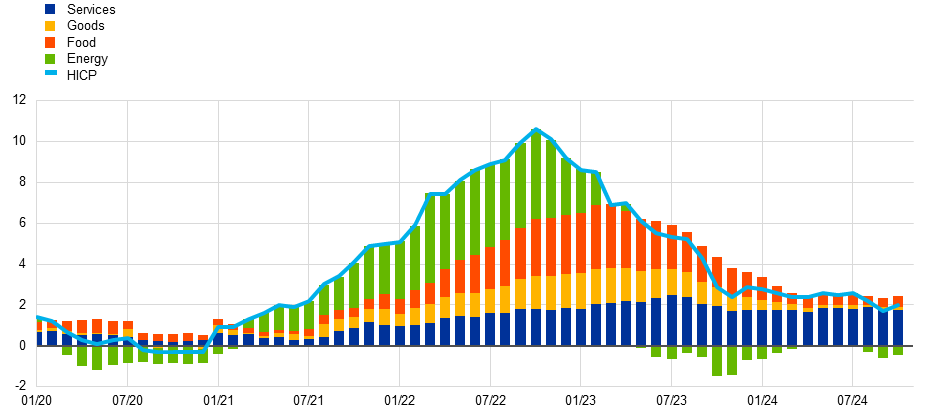
Inflation has come down steadily from its peak. Headline inflation declined to 1.7% in September, its lowest level since April 2021 but picked again to 2.0% in October, according to Eurostat’s flash estimate (Chart 1). These gyrations notwithstanding, the recent inflation releases reinforce the signs that price pressures have weakened and that the disinflation process is well on track. This largely reflects an unwinding of the forces that led to strong increases in the prices of energy, food and goods. Falling energy prices continued to be the main downward force for inflation in October. Services inflation – which remains more persistent – remained unchanged at 3.9%. Non-energy industrial goods inflation, while increasing to 0.5% in October, has fallen back to its pre-pandemic average. As a result, core inflation remained unchanged at 2.7% in October, down from its peak of 5.7% in March 2023. Inflation is expected to rise further in the coming months, partly because the sharp declines in energy prices during 2023 will drop out of the annual rates. It is then projected to decline to the 2% target over the course of next year, as labour cost pressures ease and the past monetary policy tightening gradually feeds through to prices.
Chart 1
HICP inflation
(annual percentage changes and percentage point contributions)

Based on an ongoing assessment of the inflation outlook, the dynamics of underlying inflation and the strength of monetary policy transmission, the Governing Council decided to begin moderating the degree of policy restriction in June by cutting interest rates by 25 basis points. Since then, we have reduced the rate on the deposit facility – the rate through which we steer the monetary policy stance – by a further 50 basis points to its current level of 3.25%.
The outlook for the euro area economy – income and consumption growth
Turning to the growth outlook, euro area GDP rose by 0.4% in the third quarter of 2024, up from 0.2% in the second quarter, possibly reflecting the buoyant summer tourism season and one-off factors such as the Olympics in France. But, after a mild recovery in the first half of 2024, the latest economic indicators continue to suggest a weakening in activity across countries and sectors. Industrial production has been particularly volatile over the summer and the more interest-sensitive manufacturing sector has contracted for the 19th consecutive month, though at a slightly slower pace than in September. The manufacturing output Purchasing Managers’ Index (PMI) has remained well below 50 since August 2022, registering 45.9 this October. In the services sector, activity in August was probably supported by a strong summer tourism season. That sector is still expanding, but at a slower pace, with the PMI edging down to 51.2 in October from 52.9 in August. These latest readings signal a weaker near-term outlook than projected by ECB staff in September.
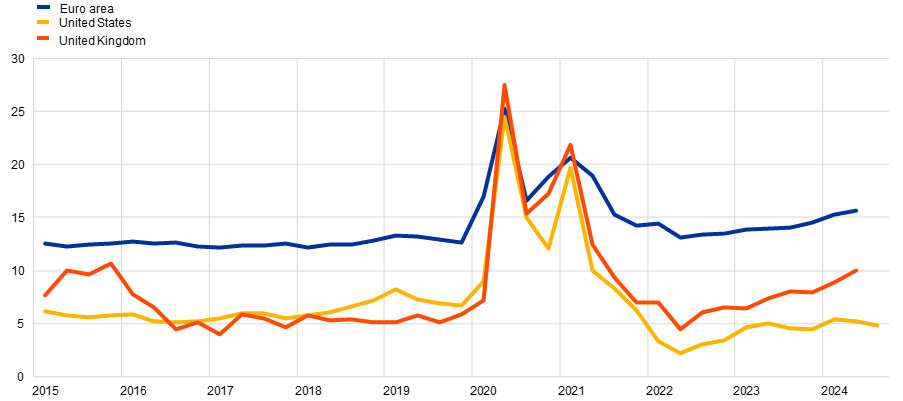
A key mechanism underpinning the growth outlook is the recovery in private consumption, supported by growth in households’ real incomes. As inflation has declined, households’ real disposable incomes have recovered. Private consumption growth, on the other hand, has slowed, and remains anaemic. As a result, the savings rate, which had declined sharply after the pandemic shock, has risen steadily since mid-2022, and reached 15.7% in the second quarter of this year, significantly above the pre-pandemic average of 12.9% (Chart 2). This raises the question of why household consumption growth in the euro area has remained so weak. Why are households saving larger proportions of their incomes? And what does this mean for the growth outlook?
Chart 2
Evolution of savings rate
(percentage)
Sources: Eurostat, Bureau of Economic Analysis, Office for National Statistics. Notes: Data are seasonally adjusted. Savings rate correspond to the ratio between gross savings and gross disposable income. The latest observations are for the second quarter of 2024 for the EA and the UK and for the third quarter of 2024 for the US.
The recent increase in the savings rate can be attributed to several factors. First, as I have already discussed, both high inflation and rising interest rates in response to the inflation surge may have eroded real net wealth. Over the past two years, real net wealth has declined by 4%. This may have encouraged saving to recuperate past losses. Second, higher real returns on savings and a higher cost of borrowing may have increased incentives to postpone consumption and reduce new borrowing. Third, non-labour income, such as self-employment remuneration, net interest receipts, dividends and rents has grown by 4.1% over the past two years. But the propensity to save out of those sources of income is much higher than for, say, wages, because non-labour income typically accrues to wealthier households that have a low marginal propensity to consume. Indeed, the data tell us that the savings rate is higher among households in the top income quintile. Fourth, inertia or persistence in consumption and savings habits is also likely to create a lag in the way consumption responds to rising incomes. Finally, the concept of permanent income can also be an important determinant of consumer spending. Households may limit their spending if they fear that their permanent income, expected over their lifetime, has not increased by as much as their current disposable income today. Fiscal policy also plays a role here. Consumers may save more if they expect taxes to rise to service higher public debt in the future – in the spirit of the so-called Ricardian equivalence.
So, what does this mean for the current state of the economy? Is there a disconnect between growing real incomes and weak consumption growth?
The key determinants of high savings are expected to persist, though likely to a lesser extent, over the course of next year. In particular, the drive to recover net wealth and the slow adjustment in consumption should become less relevant as factors holding back higher spending dissipate. Indeed, survey evidence points to a gradual recovery in household spending, with retail sales edging up in August and the European Commission’s consumer confidence indicator rising in September. Price and wage adjustments should also play a powerful role in reviving consumption. Over the past three years, the slowdown in consumption growth has been primarily due to a drop in purchases of non-durable goods like food and energy, which have been most affected by the rising prices. However, with food and energy inflation moderating and purchasing power increasing, spending should start to respond. And there are already indications that the consumption of goods increased over the summer, with a small uptick in retail trade in August.
Overall, this evidence suggests that private consumption growth will pick up, supported by ongoing robust growth in real labour income, lower inflation and improving consumer confidence. This expectation is also consistent with our September 2024 projections, which indicate that, as incomes continue to rise, inflation moderates and confidence strengthens, consumption will grow, albeit with savings remaining above pre-pandemic levels. Notwithstanding the near-term headwinds, the overall conditions for a pick-up in growth remain in place. The gradually fading-out of the effects of restrictive monetary policy should support both consumption and investment, and exports should contribute to the recovery as global demand rises.
Distributional effects of inflation and monetary policy
This brings me on to monetary policy transmission, a key element of our reaction function. One important factor affecting transmission of monetary policy to inflation and growth relates to the distribution of income and wealth across households. Inflation surges, along with the response of monetary policy, can have significant distributional effects.[2] This matters for central banks because both the distribution and sources of income and wealth influence households’ consumption and savings decisions, and ultimately, inflation.
Inflation is often said to be a tax on the poor, especially when wages do not keep up with prices.[3] To the extent that inflation often goes hand-in-hand with rising food and energy prices, for example, it disproportionately affects poorer households because these items make up a larger share of their consumption basket. According to the most recent Eurostat Income, Consumption and Wealth experimental statistics, energy and food items together make up around 30% of the disposable income of households in the lowest income quintile, compared to 12% for the highest quintile.[4] And poorer households typically have lower savings buffers to be able to withstand a temporary erosion of their real purchasing power.
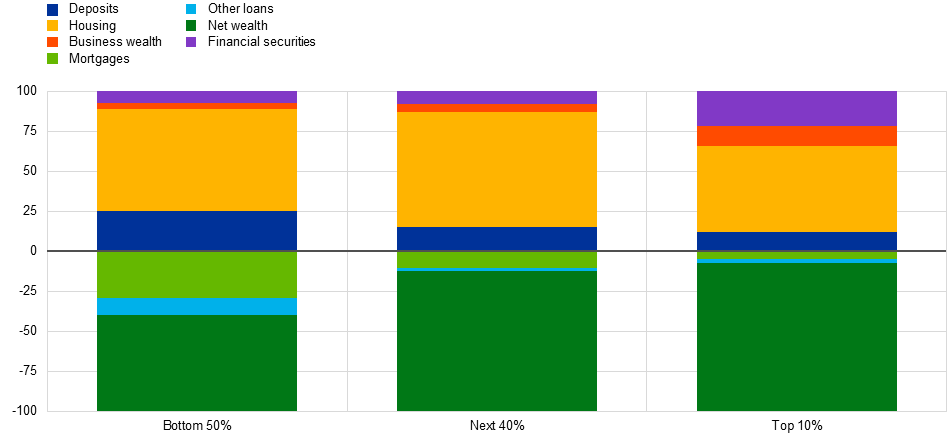
However, inflation can also act as a transfer of resources from net savers to net borrowers, partly because it lowers the real value of debt. This potentially reduces wealth inequality. As such, the composition of assets and liabilities influences how inflation surges, such as those observed recently, affect household wealth across the distribution. In particular, on the face of it, unanticipated inflation appears to reduce wealth inequality by redistributing wealth from lenders to borrowers through changes in the real value of assets and liabilities – a mechanism known as the Fisher channel.[5] This channel is strongest when incomes adjust to inflation, reducing the payment burdens falling on indebted households, who are usually in the lower half of the wealth distribution (Chart 3).
At the same time, changes in real interest rates have different valuation effects on different types of assets and liabilities. The Fisher channel weakens when unexpected inflation reduces the real interest income of low and medium-income households, who often hold their wealth in bank deposits, and increases the profit income of high-income households, who often also have wealth invested in stock markets.[6] These different wealth channels are important as they influence the transmission of monetary policy to aggregate consumption and spending, and ultimately to inflation. Wealthier households typically have a lower marginal propensity to consume and carry less debt, making them less sensitive to interest rate changes.
The newly developed Distributional Wealth Accounts (DWA) are experimental statistics that can be used to analyse the distributional effects of inflation and monetary policy in the euro area. A recent study, published in the ECB’s Economic Bulletin, shows that around 80% of financial securities – such as equities, investment fund shares and bonds – are held by the top 10% of wealthiest households, while the bottom 50% hold a greater proportion of their wealth in bank deposits and housing, though the latter is often financed by mortgage debt (Chart 3).[7]
Chart 3
Composition of net wealth distribution
(percentages of group-specific net wealth; percentage point changes)
Sources: ECB (DWA) and ECB calculations. Notes: Net wealth is shown with a negative sign. Financial securities include equities, debt securities, investment funds and life insurance. The latest observations are for the fourth quarter of 2023. 
To assess the impact of inflation on the distribution of wealth, changes in real net wealth can be decomposed into contributions from transactions, real asset revaluations, and erosion due to inflation.[8] Since mid-2021, real net wealth has declined across all wealth groups, but higher inflation has mitigated losses for poorer households by reducing the real value of their liabilities by more than their assets. Conversely, wealthier households have seen losses amplified by their larger nominal asset holdings. This wealth redistribution from savers to borrowers occurs mechanically through balance sheet positions but does not account for other factors such as interest income flows and debt repayments. Wealthier households have experienced larger real losses primarily due to the revaluation of financial assets like shares and bonds amid rising interest rates, even though they saved more and faced less dramatic declines in real house prices than poorer households.
By aiming to keep inflation close to target, monetary policy can help to mitigate these distributional effects. But monetary policy itself can affect the distribution of income and wealth through several, often offsetting, channels. The primary channels are changes in asset prices and the differing effects of interest rates on savings versus debt costs. Empirical evidence suggests that monetary policy tightening reduces net wealth across the wealth distribution.[9] The bottom 50% of households are mainly affected through housing wealth, while the top 10% feel more of an impact through financial wealth. Despite larger initial losses, the wealthiest tend to recover more quickly due to faster rebounds in equity prices compared with house prices.[10] Rising interest rates are also likely to be more challenging for poorer, more indebted households, as they increase the interest burden of debt. And because poorer households tend to have lower cash buffers and are less able to access lines of credit, if needed, it may be harder for them to cope with these rising financing costs. This is then also likely to weigh on their consumption via a debt overhang channel.[11]
The forceful monetary policy response has helped limit the direct effects of surging inflation on poorer households. At the same time, our monetary policy tightening may have eroded net wealth across the spectrum while also having important distributional consequences, with implications for the economic outlook as we continue to battle inflation.
Conclusions
The decision in October to lower the deposit facility rate – the rate through which we steer the monetary policy stance – by 25 basis points was based on our updated assessment of the inflation outlook, the dynamics of underlying inflation and the strength of monetary policy transmission. The incoming information on inflation shows that the disinflationary process is well on track. The inflation outlook is also affected by recent downside surprises indicators of economic activity, while financing conditions remain restrictive. Fine-tuning monetary policy decisions is complex but the medium-term orientation of inflation is clear.
Our interest rate decisions will continue to be based on our assessment of the inflation outlook in light of the incoming economic and financial data, the dynamics of underlying inflation and the strength of monetary policy transmission. We will continue to follow a data-dependent and meeting-by-meeting approach to determining the appropriate level and duration of restriction, without pre-committing to a particular rate path.
คำแนะนำการอ่านบทความนี้ : บางบทความในเว็บไซต์ ใช้ระบบแปลภาษาอัตโนมัติ คำศัพท์เฉพาะบางคำอาจจะทำให้ไม่เข้าใจ สามารถเปลี่ยนภาษาเว็บไซต์เป็นภาษาอังกฤษ หรือปรับเปลี่ยนภาษาในการใช้งานเว็บไซต์ได้ตามที่ถนัด บทความของเรารองรับการใช้งานได้หลากหลายภาษา หากใช้ระบบแปลภาษาที่เว็บไซต์ยังไม่เข้าใจ สามารถศึกษาเพิ่มเติมโดยคลิกลิ้งค์ที่มาของบทความนี้ตามลิ้งค์ที่อยู่ด้านล่างนี้
Source link


